McGrath Real Estate (MEA ASX) reported an earnings downgrade mere 6 month after raising $129 million dollars in December 2015. Company blamed slowdown of property listing volumes, specially the franchises it bought as part of the IPO. The slowdown is attributed to the lower than expected Chinese investor enquries.
McGrath Real Estate is the 3rd largest residential real estate broker in Australia. Worryingly the weakness is coming the largest residential market, NSW which accounts for 31.8% of the national market. If ASX MEA is facing a challenging residential market then the overall sector must face the same pressures.
To us it was no surprise that the residential real estate market is slowing down in Sydney. The latest trend in Sydney auction clearance rates are below year on year comparable numbers. Other indicator like total listings and prices are not looking too healthy. The froth is out of the Sydney housing bubble.
The key question is if this is a localized problem in Sydney alone or a broader trend across Real Estate Australia wide.
Perth house prices are already 18 month in the correction. Brisbane is not so hot either. Melbourne CBD is facing apartment glut. In the next 12 month the key test for Sydney is if it can absorb all the apartment supply coming online.
From where we are standing we are seeing a clear trend is slowing house prices across Australia. MEA is just the cannery in the coal mine.
Exhibit 1 – Australia Quarterly Residential Property Sales (Volume and Median Sale Prices)
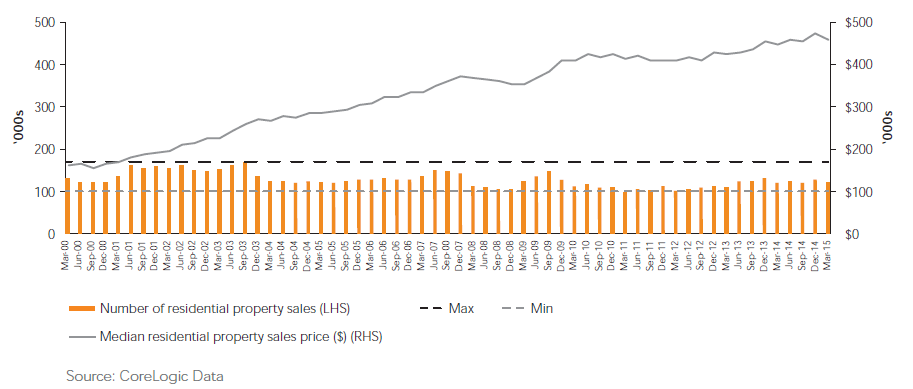
The chart above shows the bull market in house prices has rarely seen a slowdown in the last 15 years. This is not including the run up in prices leading to the Sydney Olympics. Also the last recession was in early 1990.
A large segment of the market has never experience a material decrease in house prices. Just like the US and European markets, property prices can go down as well as up.
We know given the loan exposure in the big 4 banks, there are a number of leveraged home owners and investors out there. Any slow down in the price growth will have material effect across the Australian economy.
Exhibit 2 – National Average LVR over time
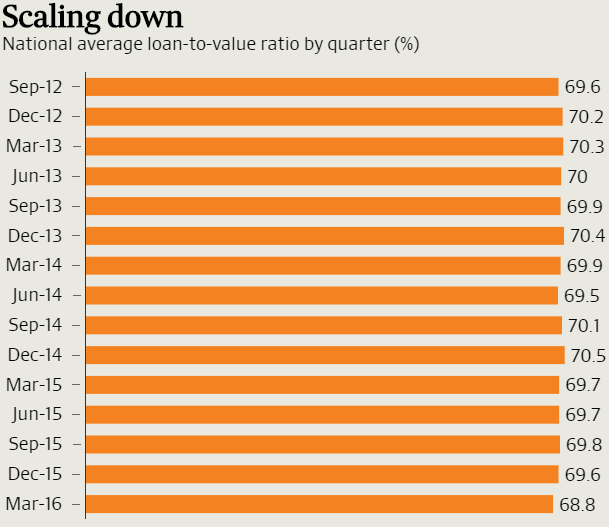
The above chart courtesy of the Australian Financial Review shows the Loan to Value ratio over time. Looking at Exhibit 1 and Exhibit 2 together shows the true extent of the absolute leverage built into the system as house prices ran up the curve.
Increase in outstanding loans against housing matched the increase in house prices over the last 15 years. Chart above breaks down quarterly LVR ratios which is consistently 70% over the last 3 years. The implication is that as value increased, more debt is added within the system. This poses a true risk for the Australian banks.
One thing we liked about MEA is that John McGrath still owns more than 50% of the company. This means the management still has skin in the game unlike some pre GFC floats where it pretty much fleeced retail investors (anyone remember RAMs Home Loan IPO?).
Our only disappointment was that we could not get short sale borrow on the stock from our broker when the share price was higher. No position on the stock.